


Getting Involved in Bitcoin
11 years ago
To be sure, we are presently living in an unusual world, in that the Fed is pegging the Fed funds rate at effectively zero. But it is not stimulating robust demand for credit, or alternatively, it is not stimulating bankers to gin up demand for credit by loosening terms and conditions to prospective borrowers. Actually, reality is probably a bit of both: reluctant borrowers and reluctant lenders.
Thus, we can categorically say that the near-zero Fed funds rate is not, for the moment, fueling an inflationary pace of aggregate demand growth relative to the economy’s supply potential. And neither is the Fed’s Credit Easing, which is the proximate cause for the explosion of excess reserves in the system. Yes, in the fullness of time, zero Fed funds could conceptually re-ignite borrowers’ and lenders’ mojo. Indeed, that’s precisely the Fed’s objective. And if and when that objective is achieved, the Fed funds rate will need to be hiked to temper the re-ignited mojo, so as to prevent the economy from overheating.This part is way too keynesian even for McCulley. Kasriel finds a correlation of 0.64 between M2 and inflation, and only 0.08 (!) between the output gap and inflation. Also, look at how inflation flamed up in 1934 while the unemployment rate was in the high teens.
 First post in a long time... CFA exam and all that. From CR:
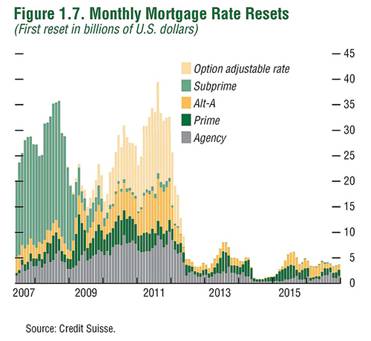
And here is a repeat of the most recent reset / recast chart from Credit Suisse.
Credit Suisse is using recast dates for Option ARMs and reset dates for all other loans.
As Tanta noted: "Reset" refers to a rate change. "Recast" refers to a payment change.
Resets are not a huge problem as long as interest rates stay low, but recasts could be significant. There are some questions about how the Wells Fargo pick-a-pay portfolio fits into this chart, since Wells Fargo doesn't expect significant recasts until 2012 (see A Bank Is Survived by Its Loans )
What we can observe is that valuations are now in the high-normal range on the basis of normalized earnings. Stocks are no longer undervalued except on measures that assume that profit margins will permanently recover to the highest levels in history (in which case, stocks would still only be moderately undervalued). For instance, the price-to-peak earnings multiple on the S&P 500 is only about 11, but those prior peak earnings from 2007 were based on record profit margins about 50% above historical norms, largely driven by the excessive leverage that has since sent the economy reeling.
On normalized profit margins, valuations are above the historical average, and prospective long-term returns are below the historical average. Overall, I expect the probable total return on the S&P 500 over the coming decade to be about 8% annually, provided we don't observe much additional deleveraging in the economy. At the 1974 and 1982 lows, based on our standard methodology, the S&P 500 was priced to deliver 10-year total returns of about 15% annually. While it has become quite popular to talk about 1974 and 1982, the stock market is presently not even close to those levels of valuation.


Since this crisis began, the profile of mortgage resets has been well-correlated with subsequent foreclosures. . . .
As the recent housing bubble progressed, the profile of mortgage originations changed, so that at the very peak of the housing bubble, new originations took the form of Alt-As (low or no requirement to document income) and Option-ARMs (teaser rates, with no required principal repayments).A broader profile of mortgage resets is presented below (though even this chart does not include the full range of adjustable mortgage products).
This reset profile is of great concern, because the majority of resets are still ahead. Moreover, the mortgages to which these resets will apply are primarily those originated late in the housing bubble, at the highest prices, and therefore having the largest probable loss.
 This graph shows NSA monthly existing home sales for 2005 through 2009. Sales (NSA) were lower in February 2009 than in February 2008.
 The second graph shows inventory by month starting in 2004.
 This graph shows existing home sales (left axis through February) and new home sales (right axis through January).
I am writing to you with reference to the latest Econtrarian, in which you explain that a decrease in the amount of stocks that an individual buys as a proportion of its income does not lead to an increase in the money supply since "XYZ’s bank account is debited by the same amount that the employee’s bank account is credited. No new money is created in this process. All that has happened is that the ownership of money has changed".
I can try to extend the argument to the case where an individual sells previously owned stocks and decides to hold the proceeds in her bank account: since there has to be a seller for every buyer, the seller's bank account will decrease by the same amount as the increase in the buyer's account, and so no net new money has been created.
However, I am wondering what you think about the case where someone sells stocks to a foreign buyer (which is likely to have happened in the recent past, as holdings of foreign equities by U.S. investors have decreased significantly). Then, could it be that the U.S. money supply has increased in the process, while matched by an equal decrease in the money supply in the foreign buyers' countries? This could lend support to Asha Bangalore's February 19th argument that "Inflation adjusted money supply is advancing because currency, demand and saving deposits have risen sharply. At the same time, bank lending has contracted", which otherwise would be at odds with your view.
Unless the foreign buyer borrowed dollars to purchase the dollar-denominated stock or bond, there is no increase in the U.S. money supply. If no borrowing occurred, then the foreign buyer would have to purchase dollars in the forex market to pay for the stock/bond purchase, which, again, just changes the ownership of dollars but does not increase the supply. The foreign purchaser of stocks/bonds presumably purchases the dollars with her own currency, which changes the ownership of that currency.
I have to admit that I am perplexed as to why the U.S. money supply, excluding currency and retail money market shares, is increasing as rapidly as it is when bank credit and bank assets are declining. Assets equal liabilities plus net worth. With commercial bank assets declining in recent weeks (assets soared back in October due to JP Morgan's assumption of WAMU, a savings & loan), then liabilities plus net worth also must be declining. If net worth and other liabilities are declining, then it would be possible for deposits to be rising even though total assets are falling. The data indicate that this is what is happening. But I still do not understand the process by which this is occurring. I am skeptical that advances in the money supply are as "stimulative" as otherwise when bank assets and bank credit are contracting.
Paul
Trillions will be required in the U.S. alone and it is critical that there be a high degree of policy coordination among all nations, which avoids protectionist measures reflective of failed policies in the 1930s. To date, PIMCO’s Mohamed El-Erian’s imperative of “shock and awe” has been more like “don’t bother us, we’re working on it.” Get moving. Risk being bold – Washington.http://www.pimco.com/LeftNav/Featured+Market+Commentary/IO/2009/Investment+Outlook+Bill+Gross+March+2009+Hairy+Lips+Sink+Ships.htm
(...) Global willingness to accept American dollars is being tested. Granted, the U.S. currency has appreciated strongly against its counterparts during most of this crisis, but technical short covering as opposed to a flight to quality may have been the dominant consideration. Watch the dollar. If it falls hard, there may be nothing policymakers can do to restore the ensuing financial chaos.
On July 8, 1932, the Dow sunk to its final bear market low of 41.22.
As soon as the Dow passed that low, volume on the NYSE suddenly soared to 4-5-6 million shares as the market surged higher. A new bull market had started amid the Great Depression. At that time, nobody had any money. The nation was broke. And yet when the market following July 8 turned from bear to bull, volume exploded. The market in its amazing wisdom, immediately recognized the turn. And from a "broke America," money poured into Wall Street as volume on the NYSE surged. I always wondered where that money came from -- wasn't it remarkable -- and it is a lesson I'll never forgot. When the price is right, the money will be there.
Which is why I've recommended gold coins. In a funny way, once you buy some coins you are stuck with them. It's so much trouble to buy the coins, that once you buy them and take physical delivery, you tend to sit with them. It's even more trouble to sell the coins so again -- you sit with them. Over time, those who bought the coins and have sat with them -- have done best in the gold bull market. They never traded in and out of the bull market, and they necessarily stayed with the great primary bull trend in gold. In other words, by "doing nothing" they did well.I'm glad to be able to say "they" applies to me.
NEW YORK (Reuters) - Renowned investor George Soros said on Friday the world financial system has effectively disintegrated, adding that there is yet no prospect of a near-term resolution to the crisis.
Soros said the turbulence is actually more severe than during the Great Depression, comparing the current situation to the demise of the Soviet Union.
He said the bankruptcy of Lehman Brothers in September marked a turning point in the functioning of the market system.
"We witnessed the collapse of the financial system," Soros said at a Columbia University dinner. "It was placed on life support, and it's still on life support. There's no sign that we are anywhere near a bottom."
(...) the hurdles that today’s economy has to jump over to enter a recovery would appear to be much lower than the hurdles that were erected between 1930 and 1932.
In addition, the federal government is about to embark on a massive fiscal stimulus program. Will the Fed monetize much of the new debt issued to fund this program? We do not know yet. But if recent history is any guide, the answer is yes. Chart 7 shows that the growth in bank reserves in 2008 was almost 149% – an unprecedented increase. If the federal government embarks on a large spending spree and the Fed “prints” the money to fund the spending, then the pace of real economic activity is bound to increase. How long it will take for higher prices to begin to erode real activity is another question. But never underestimate the initial positive impact on aggregate demand of that powerful combination of increased federal government spending/tax cuts and a central bank running the monetary printing press at a high speed.
The economic data are likely to be abysmal through the first half of this year. The popular media will reinforce the gloom of the data. The same pundits who did not see this downturn coming will not see the recovery coming either. My advice to you is to keep your eye on the index of Leading Economic Indicators. If history is any guide, the LEI will signal a recovery well ahead of the pundits.
We've observed a small favorable divergence between the major indices and overall market breadth in recent weeks, as investors have begun to pick the wheat from the chaff. There is no assurance that this process will continue, (...) however, it's a good sign to observe investors being more discriminating about investment quality, because it allows investment returns on the basis of stock selection, without relying on sustained gains in the overall market.
Barron's Magazine
January Senior Loan Officer Survey Includes Many Positive Aspects
Asha G. Bangalore, Northern Trust Global Economic Research
February 2, 2009
The Senior Loan Officer survey of January 2009 contains many noteworthy aspects that bear good tidings. There were fewer bank officers reporting they had tightened loan underwriting standards for commercial and industrial loans for both small and large firms in January compared with December (see charts 1 and 2). The fact that some bank officers have eased mortgage underwriting standards is notable but the levels still exceed the peak reported in 2001 (see charts 1 and 2). In the case of both large and small firms, the demand for loans was weaker in January compared with December. Although the history of these data is short, in 2001, the demand for loans turned around only after the recession had reached its last leg, where as the peak for the number of banks reporting tightening standards peaked slightly ahead.
There is a theory in particle physics, known as the many-worlds hypothesis, which posits that there are an inifinite number of universes, with a new one created whenever a particle's qunatum wave function "collapses." Readers of Philip Pullman's His Dark Materials trilogy will be familiar with one "practical" interpretation of the hypothesis, wherein similar but slightly different universes overlap each other.
Macro Man can confirm that this is in fact the case, as he possesses a rather unique newswire that feeds in from one of the alternative universes. He usually keeps it under wraps in the bottom of a drawer, but sometimes feels compelled to have a look at it when real-world news headlines leave him scratching his head. He finds that the alternative universe newswire sometimes offers a fresh, more truthful perspective on events than his everyday sources of news.
Recently, he's taken to looking at the alternative newswire with depressing frequency. Consider the following real-world headlines that have crossed his screen recently, and compare them with the alternative-universe newsfeed:
Our world newsfeed(OWN): Russia, China blame woes on capitalism
Alternative world newswire (AWN): Wen, Putin admit Martingale forex strategies "misguided".
In gambling, a Martingale strategy is one in which one's stake is doubled after every losing bet until he finally wins (or loses all his money.) If one possesses infinite wealth, this strategy will deliver a profit of the original stake when one finally wins; in the real world, however, its practitioners usually bust before finally winning.
In markets, the term refers to adding to a losing trade to "improve your average". Unsurprisingly, market punters usually achieve similar results to roulette players in using the strategy.
And in macroeconomics, it has come to mean an endless cycle of buying foreign exchange reserves to maintain an artificially weak exchange rate, regardless of the negative externalities of such a policy. To be sure, the US is culpable for a great deal of the current global economic stress, but this does not absolve either China or Russia for pursuing their own misguided policies which have generated a collosal misallocation of resources.
That the ongoing travails of the rouble has impaired the kleptocrats' financial standing in some small degree provides at least one small rainbow in an otherwise never-ending torrent of doom and gloom.
OWN: Brown says UK was right to sell gold in 1999, says UK bought euros by selling gold
AWN: Brown admits selling XAU/EUR below 300 was "collossally stupid"
The high print in XAU/EUR in 1999 was 270. It is now 632. Macro Man isn't sure what is worse: that Gordon Brown is too stupid to understand that that is a bad trade, or that he thinks that YOU are too stupid to understand that that is a bad trade. OWN: "We foresaw economic downturn," Trichet says.
AWN: Trichet reveals ECB forecast model (pictured, below.) OWN: Brown defends economic record, blames global crisis for downturn
AWN: Brown admits that UK is buggered
OK, maybe it's not fair to pick on Gordon twice. But the gold headline above was literally unbelievable, and the graphic below (which amde the rounds yesterday) is too good not to share.


(...) without any adjustment the 5-year TIPS currently embodies a zero inflation rate, and the 10-year carries very small 15 bps implied inflation rate (http://www.bloomberg.com/Well to be precise there are still many risks involved in investing in TIPS even at these prices: there could be more forced sales driving the yields up/prices down, an expanding liquidity risk, or rising real interest rates. But my point is that the risk/reward is extremely favorable.markets/rates/index.html ).
But I don't think that in current market circumstances we should view this as what the bond market expects inflation to be in the future. It is more likely that the same technical factors that have forced down the value of nearly every financial asset in the past few months have been at play here.
Actually when you think of the fact that the Treasury will not take back money from the holder of TIPS if the CPI turns out to be negative, then TIPS are selling at a pretty amazing value here. The risk/reward is simply not symmetric: if the CPI is zero or above you'll make as well or better than in conventional notes, and if the CPI is negative... you won't make less.
Raphael
