Monday, March 30, 2009

Mortgage resets

From Hussman:
Since this crisis began, the profile of mortgage resets has been well-correlated with subsequent foreclosures. . . .

As the recent housing bubble progressed, the profile of mortgage originations changed, so that at the very peak of the housing bubble, new originations took the form of Alt-As (low or no requirement to document income) and Option-ARMs (teaser rates, with no required principal repayments).

A broader profile of mortgage resets is presented below (though even this chart does not include the full range of adjustable mortgage products).

Loan Resets

This reset profile is of great concern, because the majority of resets are still ahead. Moreover, the mortgages to which these resets will apply are primarily those originated late in the housing bubble, at the highest prices, and therefore having the largest probable loss.

Sunday, March 29, 2009

Tuesday, March 24, 2009

More on Existing Home Sales

by CalculatedRisk on 3/23/2009 10:20:00 AM

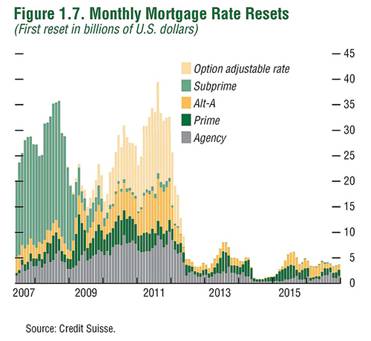
Here is another way to look at existing homes sales - monthly, Not Seasonally Adjusted (NSA):

Existing Home Sales NSA This graph shows NSA monthly existing home sales for 2005 through 2009. Sales (NSA) were lower in February 2009 than in February 2008.

Again - a significant percentage of recent sales were foreclosure resales, and although these are real sales, I think existing home sales could fall even further when foreclosure resales start to decline sometime in the future.

Existing Home Inventory 
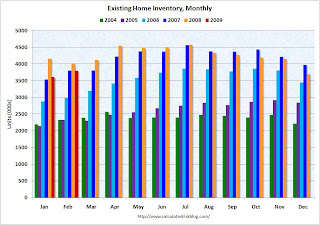
The second graph shows inventory by month starting in 2004.

Inventory levels were flat during the bubble, but started increasing at the end of 2005.

Inventory levels increased sharply in 2006 and 2007, but have been below the year ago level for the last seven months. This might indicate that inventory levels are close to the peak for this cycle. Note: there is probably a substantial shadow inventory – homeowners wanting to sell, but waiting for a better market - so existing home inventory levels will probably stay elevated for some time. There is also the possibility of some REOs being held off the market.

It is important to watch inventory levels very carefully. If you look at the 2005 inventory data, instead of staying flat for most of the year (like the previous bubble years), inventory continued to increase all year. That was one of the key signs that led me to call the top in the housing market!

If the trend of declining year-over-year inventory levels continues in 2009 that will be a positive for the housing market. Prices will probably continue to fall until the months of supply reaches more normal levels (in the 6 to 8 month range), and that might take some time.

A large percentage of existing home sales (40% to 45% according to the NAR) are distressed sales: REO sales (foreclosure resales) or short sales. This has created a gap between new and existing sales as shown in the following graph that I've jokingly labeled the "Distressing" gap.

Distressing GapThis graph shows existing home sales (left axis through February) and new home sales (right axis through January).

For a number of years the ratio between new and existing home sales was pretty steady. After activity in the housing market peaked in 2005, the ratio changed. This change was caused by distressed sales - in many areas home builders cannot compete with REO sales, and this has pushed down new home sales while keeping existing home sales activity elevated.

I think the keys to watch for the housing market are declining inventory levels, a bottom in new home sales, and the gap between new and existing home sales closing.

Tuesday, March 10, 2009

Money Supply

This post is somewhat more edgy than usual. My readers (all three of them) will have to read carefully. Here is an excerpt of an email I sent to Paul Kasriel (Director of Econ research at Northern Trust):
I am writing to you with reference to the latest Econtrarian, in which you explain that a decrease in the amount of stocks that an individual buys as a proportion of its income does not lead to an increase in the money supply since "XYZ’s bank account is debited by the same amount that the employee’s bank account is credited. No new money is created in this process. All that has happened is that the ownership of money has changed".

I can try to extend the argument to the case where an individual sells previously owned stocks and decides to hold the proceeds in her bank account: since there has to be a seller for every buyer, the seller's bank account will decrease by the same amount as the increase in the buyer's account, and so no net new money has been created.

However, I am wondering what you think about the case where someone sells stocks to a foreign buyer (which is likely to have happened in the recent past, as holdings of foreign equities by U.S. investors have decreased significantly). Then, could it be that the U.S. money supply has increased in the process, while matched by an equal decrease in the money supply in the foreign buyers' countries? This could lend support to Asha Bangalore's February 19th argument that "Inflation adjusted money supply is advancing because currency, demand and saving deposits have risen sharply. At the same time, bank lending has contracted", which otherwise would be at odds with your view.

And here is his answer:

Unless the foreign buyer borrowed dollars to purchase the dollar-denominated stock or bond, there is no increase in the U.S. money supply. If no borrowing occurred, then the foreign buyer would have to purchase dollars in the forex market to pay for the stock/bond purchase, which, again, just changes the ownership of dollars but does not increase the supply. The foreign purchaser of stocks/bonds presumably purchases the dollars with her own currency, which changes the ownership of that currency.

I have to admit that I am perplexed as to why the U.S. money supply, excluding currency and retail money market shares, is increasing as rapidly as it is when bank credit and bank assets are declining. Assets equal liabilities plus net worth. With commercial bank assets declining in recent weeks (assets soared back in October due to JP Morgan's assumption of WAMU, a savings & loan), then liabilities plus net worth also must be declining. If net worth and other liabilities are declining, then it would be possible for deposits to be rising even though total assets are falling. The data indicate that this is what is happening. But I still do not understand the process by which this is occurring. I am skeptical that advances in the money supply are as "stimulative" as otherwise when bank assets and bank credit are contracting.

Paul


If anyone believes they can contribute to the discussion, feel free to do so.

Saturday, March 7, 2009

Gross' keynesian framework starting to show its limits

Although I have an immense respect for Bill Gross (for both his accomplishments and his thinking), I have always thought he was a bit too keynesian for my taste. Now it looks like the model is being stretched (emphasis are mine):

Trillions will be required in the U.S. alone and it is critical that there be a high degree of policy coordination among all nations, which avoids protectionist measures reflective of failed policies in the 1930s. To date, PIMCO’s Mohamed El-Erian’s imperative of “shock and awe” has been more like “don’t bother us, we’re working on it.” Get moving. Risk being bold – Washington.

(...)
Global willingness to accept American dollars is being tested. Granted, the U.S. currency has appreciated strongly against its counterparts during most of this crisis, but technical short covering as opposed to a flight to quality may have been the dominant consideration. Watch the dollar. If it falls hard, there may be nothing policymakers can do to restore the ensuing financial chaos.
http://www.pimco.com/LeftNav/Featured+Market+Commentary/IO/2009/Investment+Outlook+Bill+Gross+March+2009+Hairy+Lips+Sink+Ships.htm

Friday, March 6, 2009

More Russell

On July 8, 1932, the Dow sunk to its final bear market low of 41.22.

As soon as the Dow passed that low, volume on the NYSE suddenly soared to 4-5-6 million shares as the market surged higher. A new bull market had started amid the Great Depression. At that time, nobody had any money. The nation was broke. And yet when the market following July 8 turned from bear to bull, volume exploded. The market in its amazing wisdom, immediately recognized the turn. And from a "broke America," money poured into Wall Street as volume on the NYSE surged. I always wondered where that money came from -- wasn't it remarkable -- and it is a lesson I'll never forgot. When the price is right, the money will be there.